Skateboard Activity
I thought that this activity would have been very easy to predict but it was a lot more difficult than I originally though it was. It's not that the activity in general was hard, but mostly the predictions were difficult. The first two graphs I didn't predict very well but the last one I was able to predict very accurately. The zeros of the graphs represented the skateboard at its still points, and everything in between represented the skateboards movement. All three graphs had maximums and minimums, but not all of the graphs started and stopped at zero. They all rise the fastest in the beginning of the experiment because that is when the momentum is the strongest. It starts to fall toward the second half because that is when the skateboard starts to go backwards.
I thought that this activity would have been very easy to predict but it was a lot more difficult than I originally though it was. It's not that the activity in general was hard, but mostly the predictions were difficult. The first two graphs I didn't predict very well but the last one I was able to predict very accurately. The zeros of the graphs represented the skateboard at its still points, and everything in between represented the skateboards movement. All three graphs had maximums and minimums, but not all of the graphs started and stopped at zero. They all rise the fastest in the beginning of the experiment because that is when the momentum is the strongest. It starts to fall toward the second half because that is when the skateboard starts to go backwards.
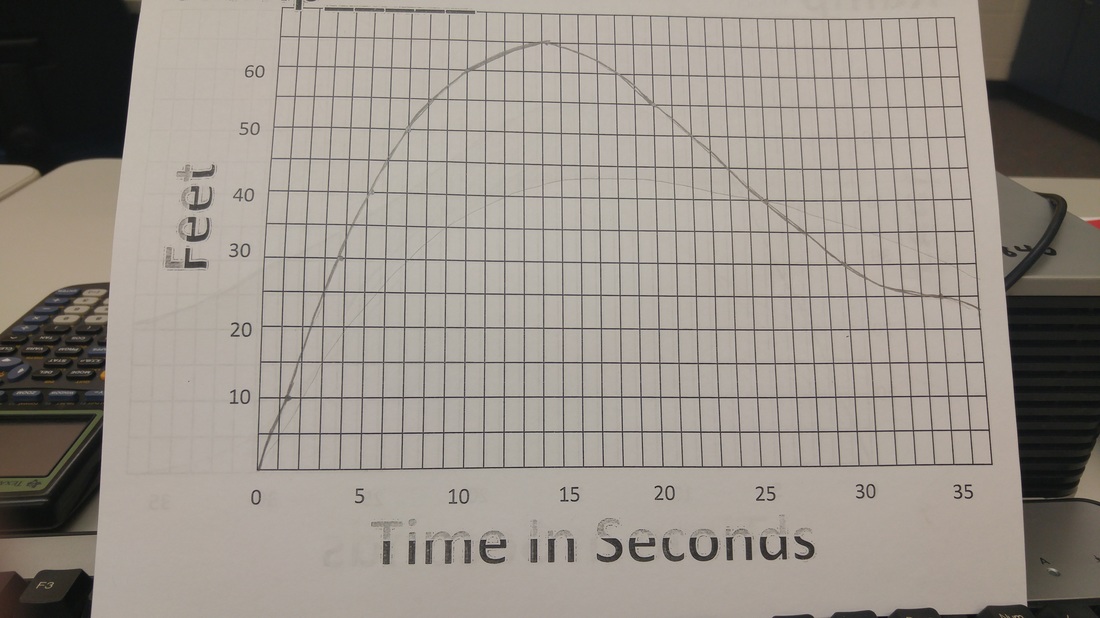
The 21in ramp
|
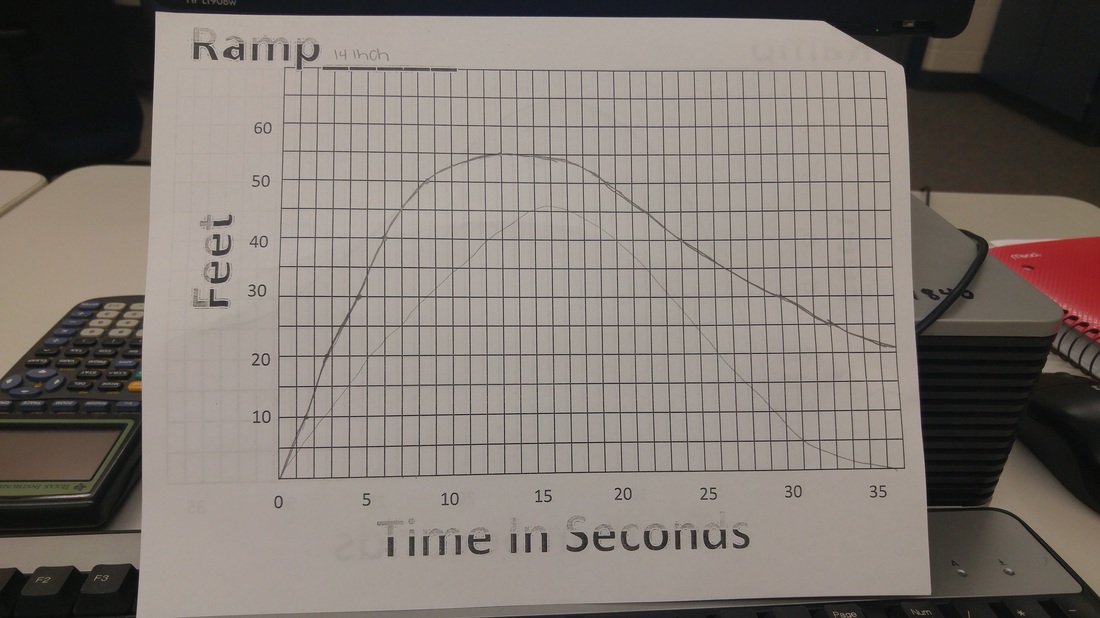
The 14in ramp
|
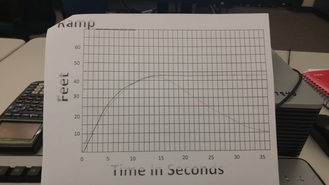
The 7in ramp
|
